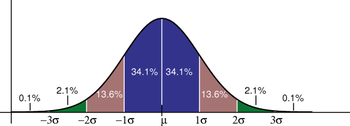
Standard Deviation Diagram Created with raw PostScript by Pat Beirne, 5/1/06. Based on an original graph created in Adobe Illustrator by Jeremy Kemp, 2/9/05 (Photo credit: Wikipedia)
When saving and investing for retirement many folks as well as advisors helping those folks plan save and invest for retirement generally will have the conversation that includes how much they can save per month or year, how much they need at retirement and how long they have to save until retirement.
Essentially, all of the ingredients in the previous paragraph boil down to a phrase mentioned many times in financial planning classes as well as courses in finance, investing and business: the time value of money.
The time value of money helps individuals and businesses figure out how much they need to save, earn, and spend in order to achieve certain financial goals. What it boils down to is what is a dollar worth, if not spent today, and instead invested and allowed to grow for tomorrow (the future).
The essential components of a time value of money equation are present value (PV), payments (PMT), future value (FV), interest rate (I) and number of periods (N).
Chances are throughout your lifetime you may have done this type of calculation yourself when calculating how much you need to save for retirement or how much you will have when you reach retirement.
For example, you may say you can save $500 per month (PMT) for 30 years (N) and if you can earn 8% (I) on your investment you’ll have roughly $745,000 (FV).
Some of you already notice the flaw in this equation: we’re assuming an average return of 8%. This means that we’re assuming our investments earn 8% per year! Here’s the problem with this assumption. Let’s say that our goal is still $745,000 for retirement and the same and years apply. Assume our average return is only 5%. What happens to how much we have to save monthly? We now have to save $895 instead of $500.
So we see that as our rate of return drops, we must contribute more. And what happens when we assume too high a rate of return? Let’s use 10% in our above example. We now only have to save about $330 per month to hit our goal. Perfect!
Wrong!
This is a big problem with not only saving for retirement but I would also argue (ahem) a big reason why defined benefit pensions (in Illinois and many states) are in trouble. Pensions don’t have to save as much for their future liabilities to pensioners when they have higher expected rates of return.
I won’t bore you with why this strategy is futile; simply re-read the last couple of paragraphs to get the idea.
Barton Waring in his book Pension Finance as well as Jim Otar in his book Unveiling the Retirement Myth write extensively on this concept in their books. Mr. Waring says that pensions assuming a higher expected return “because that’s what they can expect in the long-term” is ludicrous while Mr. Otar will mention that “averages don’t apply to individuals” – meaning what if we did get our 8% for 29 years, but lost 50% in year 30?
Both gentlemen are exactly correct.
My advice: use a smaller rate of return. You’ll definitely have to save more, but it will cause you to rely less on “averages” and more on what you can control – your ability to save.


 Sterling Raskie, MSFS, CFP®, ChFC®
 The latest in our Owner’s Manual series, A 401(k) Owner’s Manual, was published in January 2020 and is available on
  A Medicare Owner’s Manual, is updated with 2020 facts and figures. This manual is available on
  Social Security for the Suddenly Single can be found on Amazon at
  Sterling’s first book, Lose Weight Save Money, can be
  An IRA Owner’s Manual, 2nd Edition is available for purchase on Amazon. Click the link to choose the
  Jim’s book – A Social Security Owner’s Manual, is now available on Amazon. Click this link for the
  And if you’ve come here to learn about queuing waterfowl, I apologize for the confusion. You may want to discuss your question with Lester, my loyal watchduck and self-proclaimed “advisor’s advisor”.
I’d also say there can be a meaningful difference between a return advertised by an investment company and an actual investor’s true rate of return because of when funds were added and withdrawn. I prefer to focus my actual internal rate of return (IRR) to track my portfolio.
Great point, Sean. There can be big differences between time-weighted returns that a mutual fund will report and dollar-weighted returns that apply to investors.