Use this link to go to the new version for 2022 and beyond.
| Table I | |||
| (Single Life Expectancy) | |||
| (For Use by Beneficiaries) | |||
| Age | Life Expectancy | Age | Life Expectancy |
| 0 | 82.4 | 28 | 55.3 |
| 1 | 81.6 | 29 | 54.3 |
| 2 | 80.6 | 30 | 53.3 |
| 3 | 79.7 | 31 | 52.4 |
| 4 | 78.7 | 32 | 51.4 |
| 5 | 77.7 | 33 | 50.4 |
| 6 | 76.7 | 34 | 49.4 |
| 7 | 75.8 | 35 | 48.5 |
| 8 | 74.8 | 36 | 47.5 |
| 9 | 73.8 | 37 | 46.5 |
| 10 | 72.8 | 38 | 45.6 |
| 11 | 71.8 | 39 | 44.6 |
| 12 | 70.8 | 40 | 43.6 |
| 13 | 69.9 | 41 | 42.7 |
| 14 | 68.9 | 42 | 41.7 |
| 15 | 67.9 | 43 | 40.7 |
| 16 | 66.9 | 44 | 39.8 |
| 17 | 66.0 | 45 | 38.8 |
| 18 | 65.0 | 46 | 37.9 |
| 19 | 64.0 | 47 | 37.0 |
| 20 | 63.0 | 48 | 36.0 |
| 21 | 62.1 | 49 | 35.1 |
| 22 | 61.1 | 50 | 34.2 |
| 23 | 60.1 | 51 | 33.3 |
| 24 | 59.1 | 52 | 32.3 |
| 25 | 58.2 | 53 | 31.4 |
| 26 | 57.2 | 54 | 30.5 |
| 27 | 56.2 | 55 | 29.6 |
| Age | Life Expectancy | Age | Life Expectancy |
| 56 | 28.7 | 84 | 8.1 |
| 57 | 27.9 | 85 | 7.6 |
| 58 | 27.0 | 86 | 7.1 |
| 59 | 26.1 | 87 | 6.7 |
| 60 | 25.2 | 88 | 6.3 |
| 61 | 24.4 | 89 | 5.9 |
| 62 | 23.5 | 90 | 5.5 |
| 63 | 22.7 | 91 | 5.2 |
| 64 | 21.8 | 92 | 4.9 |
| 65 | 21.0 | 93 | 4.6 |
| 66 | 20.2 | 94 | 4.3 |
| 67 | 19.4 | 95 | 4.1 |
| 68 | 18.6 | 96 | 3.8 |
| 69 | 17.8 | 97 | 3.6 |
| 70 | 17.0 | 98 | 3.4 |
| 71 | 16.3 | 99 | 3.1 |
| 72 | 15.5 | 100 | 2.9 |
| 73 | 14.8 | 101 | 2.7 |
| 74 | 14.1 | 102 | 2.5 |
| 75 | 13.4 | 103 | 2.3 |
| 76 | 12.7 | 104 | 2.1 |
| 77 | 12.1 | 105 | 1.9 |
| 78 | 11.4 | 106 | 1.7 |
| 79 | 10.8 | 107 | 1.5 |
| 80 | 10.2 | 108 | 1.4 |
| 81 | 9.7 | 109 | 1.2 |
| 82 | 9.1 | 110 | 1.1 |
| 83 | 8.6 | 111 and over | 1.0 |


 Sterling Raskie, MSFS, CFP®, ChFC®
 The latest in our Owner’s Manual series, A 401(k) Owner’s Manual, was published in January 2020 and is available on
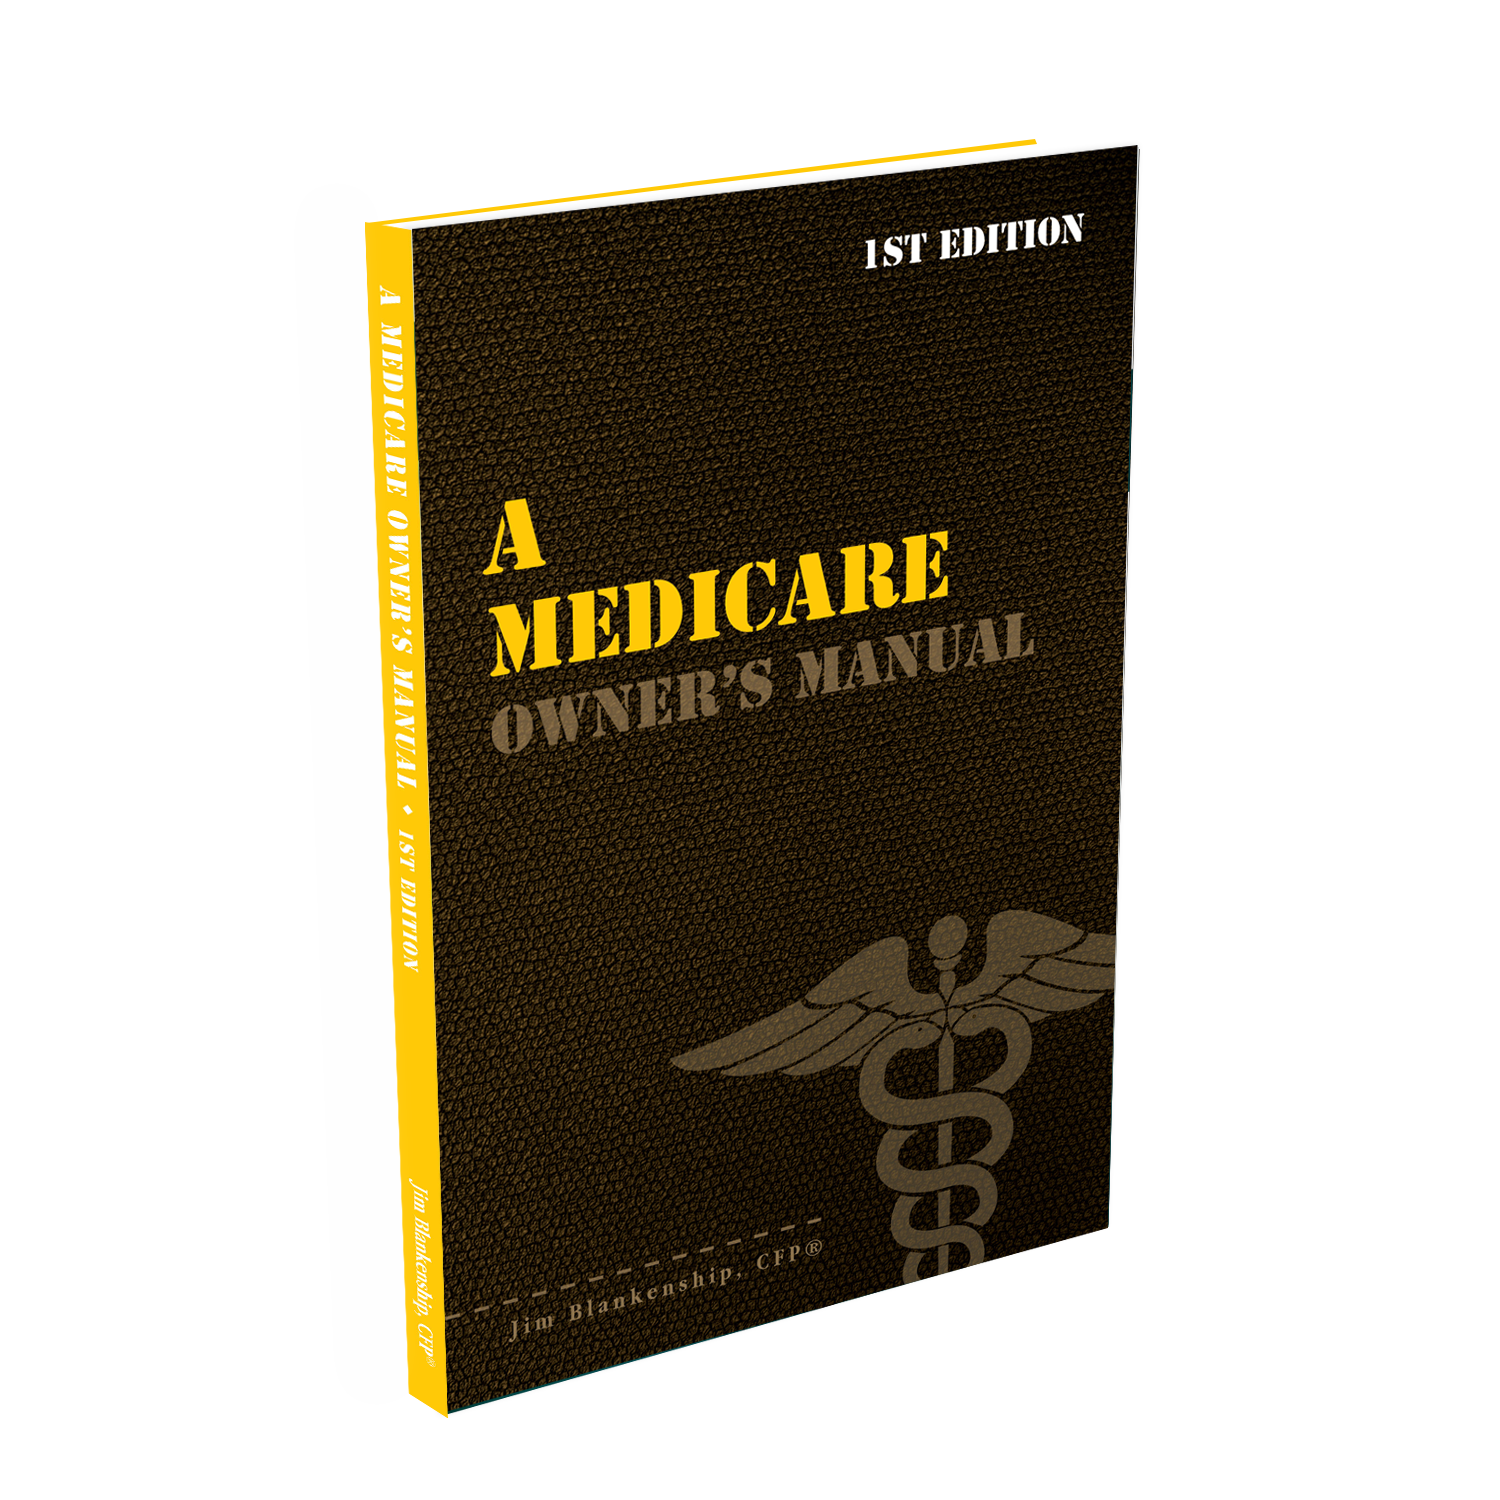
  A Medicare Owner’s Manual, is updated with 2020 facts and figures. This manual is available on
  Social Security for the Suddenly Single can be found on Amazon at
  Sterling’s first book, Lose Weight Save Money, can be
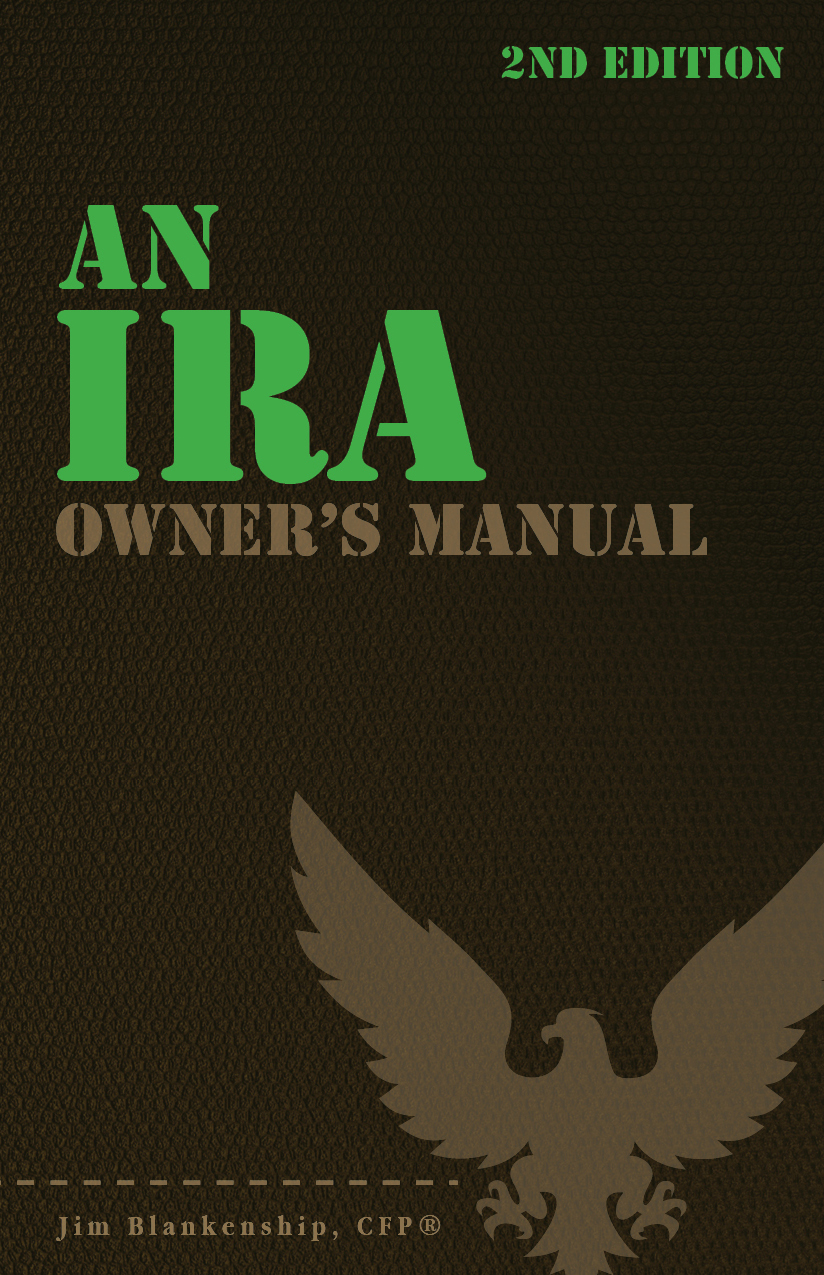
  An IRA Owner’s Manual, 2nd Edition is available for purchase on Amazon. Click the link to choose the
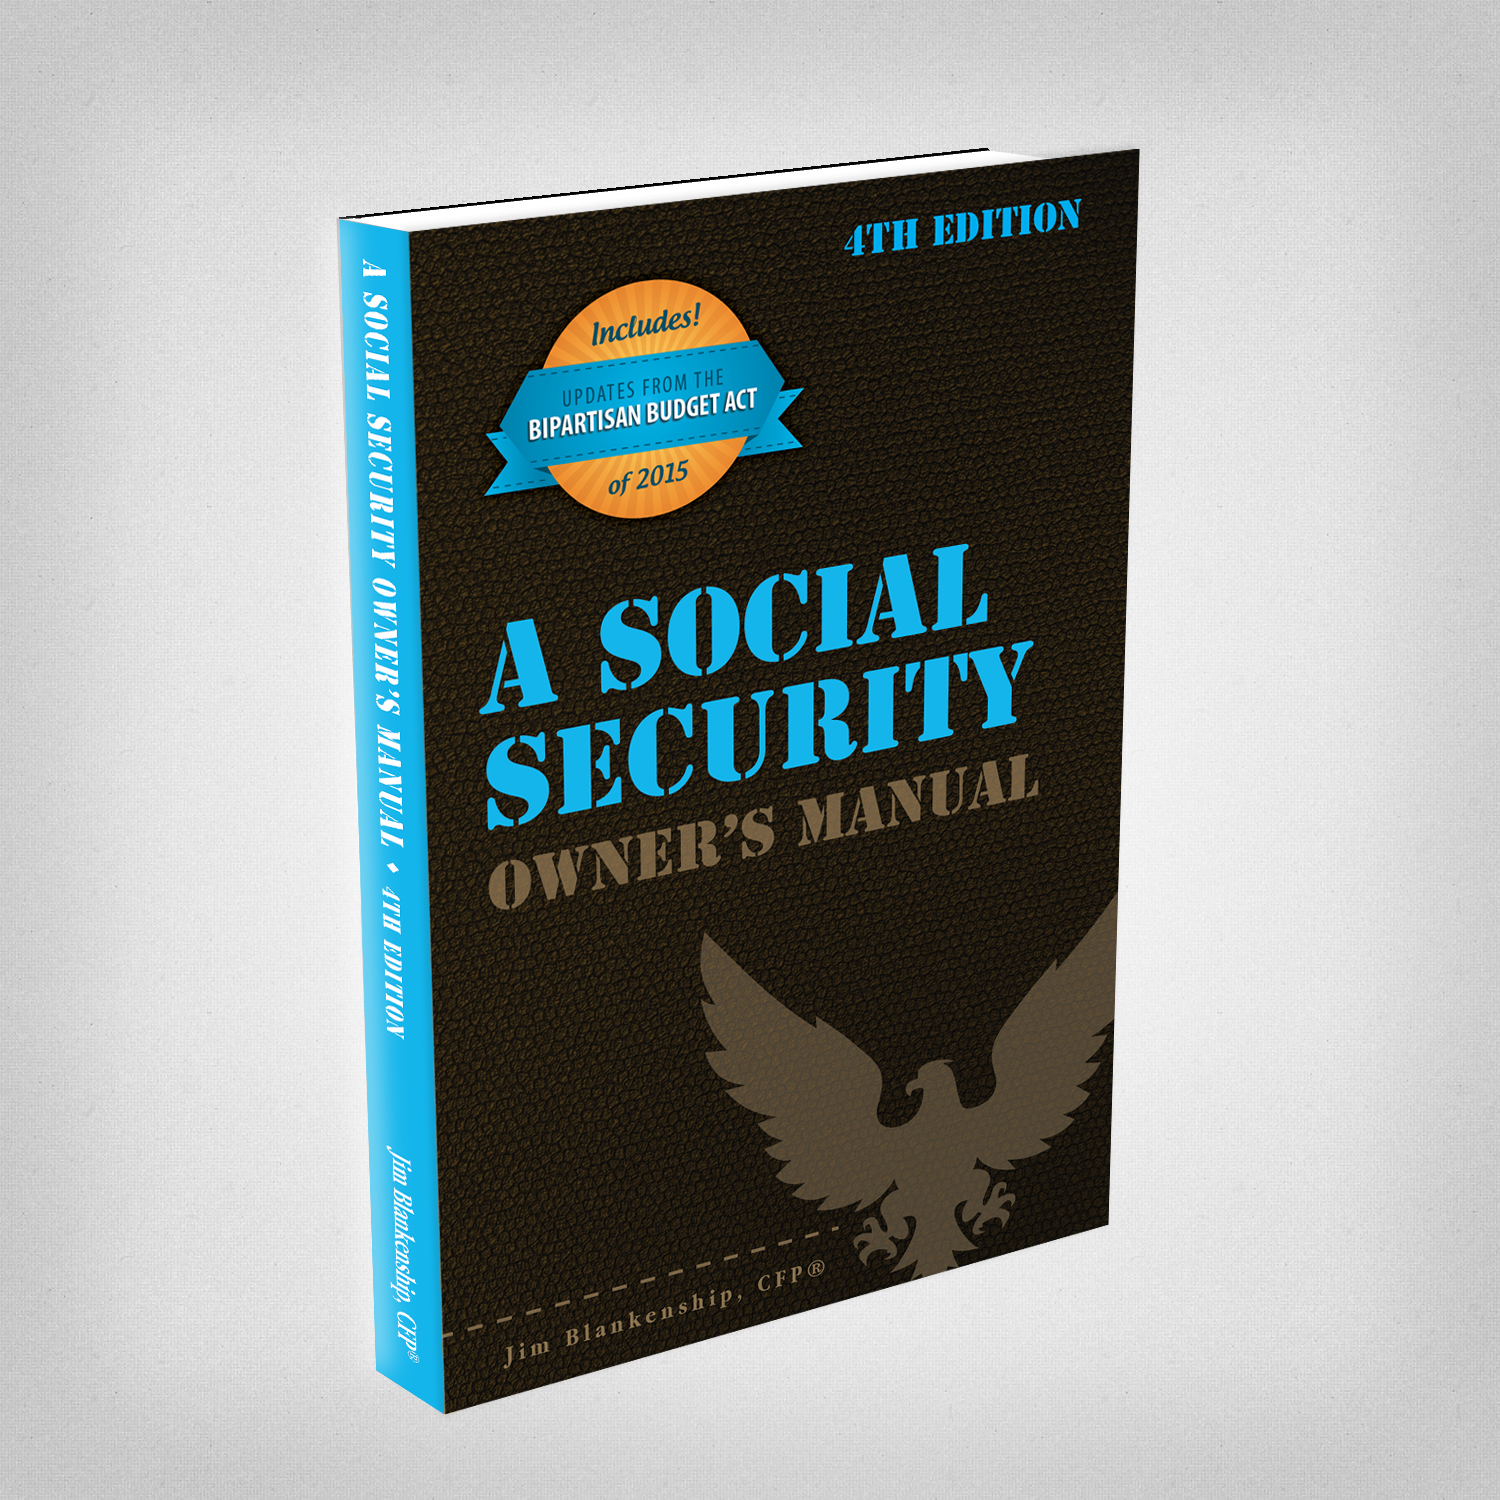
  Jim’s book – A Social Security Owner’s Manual, is now available on Amazon. Click this link for the
  And if you’ve come here to learn about queuing waterfowl, I apologize for the confusion. You may want to discuss your question with Lester, my loyal watchduck and self-proclaimed “advisor’s advisor”.